
Page 424 - RUICHSS 2023 Proceeding
P. 424
University of Ruhuna ISSN: 2706-0063
Matara, Sri Lanka
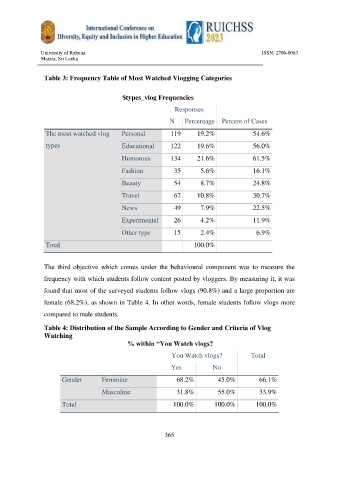
Table 3: Frequency Table of Most Watched Vlogging Categories
$types_vlog Frequencies
Responses
N Percentage Percent of Cases
The most watched vlog Personal 119 19.2% 54.6%
types Educational 122 19.6% 56.0%
Humorous 134 21.6% 61.5%
Fashion 35 5.6% 16.1%
Beauty 54 8.7% 24.8%
Travel 67 10.8% 30.7%
News 49 7.9% 22.5%
Experimental 26 4.2% 11.9%
Other type 15 2.4% 6.9%
Total 100.0%
The third objective which comes under the behavioural component was to measure the
frequency with which students follow content posted by vloggers. By measuring it, it was
found that most of the surveyed students follow vlogs (90.8%) and a large proportion are
female (68.2%), as shown in Table 4. In other words, female students follow vlogs more
compared to male students.
Table 4: Distribution of the Sample According to Gender and Criteria of Vlog
Watching
% within “You Watch vlogs?
You Watch vlogs? Total
Yes No
Gender Feminine 68.2% 45.0% 66.1%
Masculine 31.8% 55.0% 33.9%
Total 100.0% 100.0% 100.0%
365