
Page 136 - Prathima Volume 12
P. 136
The impact of Influencer Culture on Digital Hyper-Reality:
A Case Study on the Food Consumption Patterns of Sri Lankan Urban Youth
Related to the employment status of the selected sample, it was found that 70% (38)
out of the said sample were employed in various governmental and private institutions.
On the other hand, the remaining 30% (16) were mentioned to be full time
undergraduates in both private and state universities.
When considering their monthly income, there were no drastic differences. 26% of
the selected sample (14) had an income of more than Rs. 200,000 which is almost
quarter of the selected sample. Also 24% (13) reported an income ranging from Rs.
50,000 – 100,000 and Rs. 100,000 - 150,000 This income ranges compromise half of
the income range of the selected sample.
4.2 Use of social media
When inquiring into the social media presence (having a SNS account) of the selected
sample, 80% tend to use Facebook and Instagram as social media platforms. 70% also
use YouTube as a social media platform while Twitter is being utilized by 65%. In
addition, 46% use Printerest and only 2% use Myspace. However, when considering
the daily social media usage (being actively involved in social media activities such as
posting pictures, commenting and sharing content) of the respondents, statistics were
quite different compared to the social media presence as the majority (78%) uses
Facebook and 76% use Instagram on a daily basis. On the other hand, 63% use
YouTube. However, only 17% use Twitter on a daily basis.
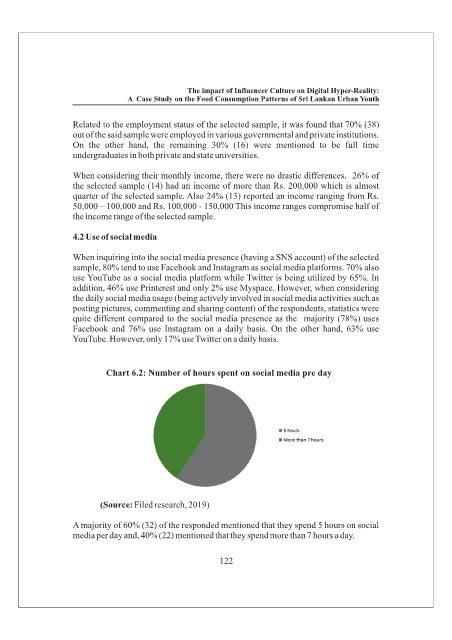
Chart 6.2: Number of hours spent on social media pre day
(Source: Filed research, 2019)
A majority of 60% (32) of the responded mentioned that they spend 5 hours on social
media per day and, 40% (22) mentioned that they spend more than 7 hours a day.
122