
Page 239 - RUICHSS 2023 Proceeding
P. 239
University of Ruhuna ISSN: 2706-0063
Matara, Sri Lanka
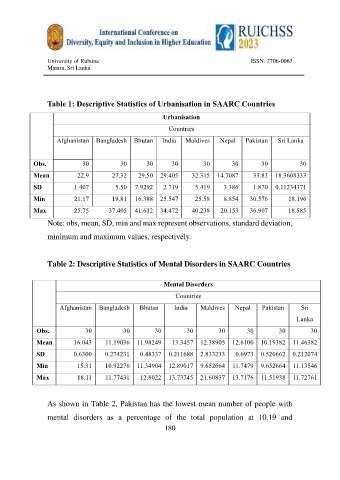
Table 1: Descriptive Statistics of Urbanisation in SAARC Countries
Urbanisation
Countries
Afghanistan Bangladesh Bhutan India Maldives Nepal Pakistan Sri Lanka
Obs. 30 30 30 30 30 30 30 30
Mean 22.9 27.32 29.50 29.405 32.315 14.7087 33.83 18.3608333
SD 1.407 5.50 7.9292 2.719 5.419 3.386 1.870 0.11234371
Min 21.17 19.81 16.388 25.547 25.58 8.854 30.576 18.196
Max 25.75 37.405 41.612 34.472 40.238 20.153 36.907 18.585
Note: obs, mean, SD, min and max represent observations, standard deviation,
minimum and maximum values, respectively.
Table 2: Descriptive Statistics of Mental Disorders in SAARC Countries
Mental Disorders
Countries
Afghanistan Bangladesh Bhutan India Maldives Nepal Pakistan Sri
Lanka
Obs. 30 30 30 30 30 30 30 30
Mean 16.043 11.19036 11.98249 13.3457 12.38905 12.6100 10.19382 11.46382
SD 0.6300 0.274231 0.48337 0.211688 2.833233 0.6973 0.520662 0.212074
Min 15.31 10.92276 11.34904 12.89017 9.652664 11.7479 9.652664 11.13546
Max 18.11 11.77431 12.8022 13.73745 21.60837 13.7176 11.51938 11.72761
As shown in Table 2, Pakistan has the lowest mean number of people with
mental disorders as a percentage of the total population at 10.19 and
180