
Page 178 - RUICHSS 2023 Proceeding
P. 178
University of Ruhuna ISSN: 2706-0063
Matara, Sri Lanka
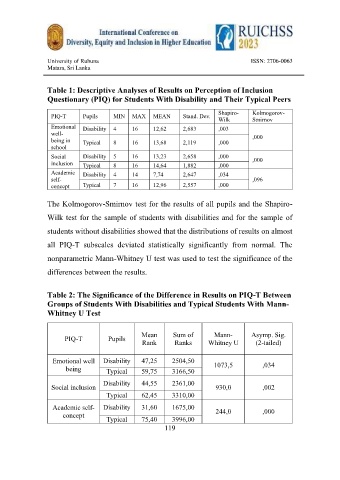
Table 1: Descriptive Analyses of Results on Perception of Inclusion
Questionary (PIQ) for Students With Disability and Their Typical Peers
Shapiro- Kolmogorov-
PIQ-T Pupils MIN MAX MEAN Stand. Dev.
Wilk Smirnov
Emotional Disability 4 16 12,62 2,683 ,003
well- ,000
being in Typical 8 16 13,68 2,119 ,000
school
Social Disability 5 16 13,23 2,658 ,000 ,000
inclusion Typical 8 16 14,64 1,882 ,000
Academic Disability 4 14 7,74 2,647 ,034
self- ,096
concept Typical 7 16 12,96 2,557 ,000
The Kolmogorov-Smirnov test for the results of all pupils and the Shapiro-
Wilk test for the sample of students with disabilities and for the sample of
students without disabilities showed that the distributions of results on almost
all PIQ-T subscales deviated statistically significantly from normal. The
nonparametric Mann-Whitney U test was used to test the significance of the
differences between the results.
Table 2: The Significance of the Difference in Results on PIQ-T Between
Groups of Students With Disabilities and Typical Students With Mann-
Whitney U Test
Mean Sum of Mann- Asymp. Sig.
PIQ-T Pupils
Rank Ranks Whitney U (2-tailed)
Emotional well Disability 47,25 2504,50 1073,5 ,034
being Typical 59,75 3166,50
Disability 44,55 2361,00
Social inclusion 930,0 ,002
Typical 62,45 3310,00
Academic self- Disability 31,60 1675,00 244,0 ,000
concept
Typical 75,40 3996,00
119